R Tutorial
The purpose of this tutorial is to walk the new user through a basic K-means analysis using H2O through R. The objective is to learn the basic syntax of H2O through R, including importing and parsing files, specifying a model, and obtaining model output.
Those who have never used H2O before should see the quick start guide for additional instructions on how to run H2O. Additionally, users who are using H2O through R for the first time will need to install the R package, available in our download package at: http://0xdata.com/downloadtable/.
Getting Started
Before beginning, be sure to have an instance of H2O running. Additionally, users who are using H2O for the first time can find help for installing the R package at http://docs.0xdata.com/Ruser/Rh2opackage.html.
Step-by-step
Step 1 Call the H2O package, and initialize H2O in R. Note that an object “H2Oconn” was created. Assigning the H2O initialization to an object is important, because the connection will be used later to tell R where to send data sets, model specification, and where to find results.
library(h2o)
H2Oconn<- h2o.init(ip = "localhost", port = 54321)
When the R package and the current running version of H2O match, the returned message tells users they are successfully connected. However, users may see notification that indicates a mismatch between the R package and running jar. In that case, the R package and jar can be made to match by following the prompts in the R console.
Step 2
Import data files, and inspect the data.
swiss.hex<- h2o.importFile(H2Oconn, "../smalldata/swiss.csv",
+ key="swiss.hex")
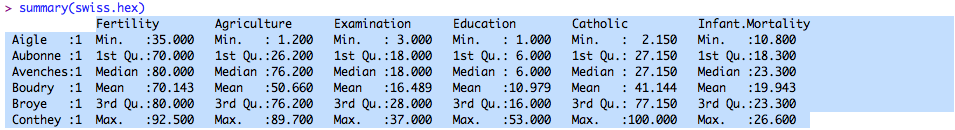
summary(swiss.hex)
Summary will return output similar to the following:
Step 3
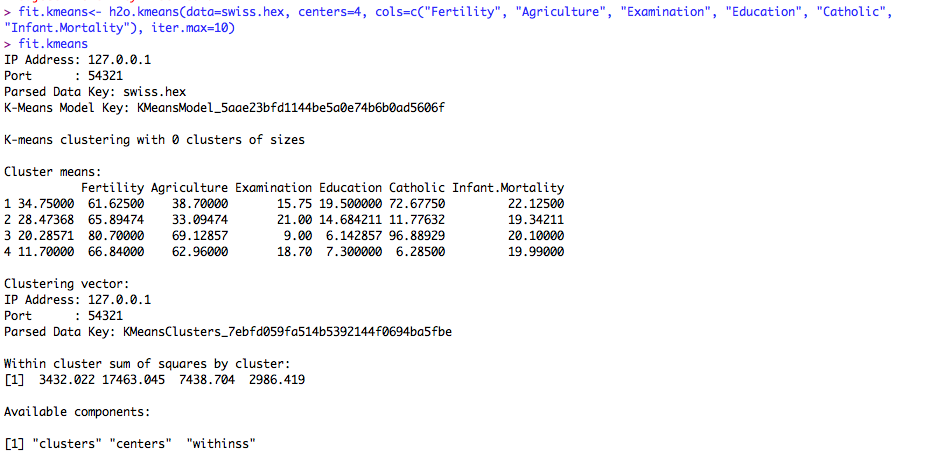
Fit a K-means model. The model specified here sets centers (the number of clusters) to 4, and asks for a model on the columns Fertility, Agriculture, Examination, Education, Catholic, and Infant.Mortality. Iter.max specifies the maximum number of iterations the algorithm should complete.
fit.kmeans<- h2o.kmeans(data=swiss.hex, centers=4,
+ cols=c("Fertility", "Agriculture", "Examination", "Education",
+ "Catholic", "Infant.Mortality"), iter.max=10)
The output of this model:
fit.kmeans
Additional Notes
The data set used in this model is “swiss”, and is included as part of the base R package. Users can view the data in its original incarnation by typing swiss at the prompt in their R console, or can view the summary of the data by requesting summary(swiss)
swiss
summary(swiss)
View your work in R through GUI When the session was initialized, a connection to a running instance of H 2O was made by specifying an IP and port. Users can point their web browsers at that same IP and port to view the work from their R session in the GUI.