Random Forest
Random Forest (RF) is a powerful classification tool. When given a set of data, RF generates a forest of classification trees, rather than a single classification tree. Each of these trees generates a classification for a given set of attributes. The classification from each H2O tree can be thought of as a vote; the most votes determines the classification.
When to use RF
RF is a good choice when your objective is classification.
Defining a Model
Source:
The parsed data set to be used in training a model.
Response:
The dependent variable to be modeled.
Ignored Columns:
The set of features from the source data set to omit from training a model.
Classification:
Specifies the model as classification.
Validation:
A .hex key associated with data to be used in validation of the model built using the data specified in Source.
N Trees:
The number of trees to generate for classification.
Max Depth:
A user-defined tuning parameter for controlling model complexity (by number of edges). Depth is the longest path from root to the furthest leaf. Maximum depth also specifies the maximum number of interactions that can be accounted for by the model.
Min Rows:
The minimum number of observations to include in each terminal node. The maximum possible observations in a terminal node is N-1, where N is the number of observations. The minimum is 1, and is the case where each observation is in a unique terminal node.N Bins:
A user-defined tuning parameter for controlling model complexity. N bins sets the number of groups into which the original data can be split.
Score each iteration:
Returns an error rate for each iteration of the training process. It is used when models are especially complex. By producing a score for the model at each iteration, users can stop the training process when the cost of continuing to model is greater than the marginal gains in predictive power.
Importance:
Returns information about the importance of each feature in the overall model.
Mtries:
At each iteration, a randomly chosen subset of the features in the training data is selected and evaluated to define the optimal split of that subset. Mtries specifies the number of features to be selected from the whole set. When set to -1, the number of features
is the square root of the total number offeatures, rounded to the nearest integer.
Seed:
A large number that allows the user to recreate an analysis by specifying a starting point for black box processes that would otherwise occur at a randomly chosen place within the data.
Build tree one node:
(BigData only)Train the model using one node, instead of using a distributed cluster with multiple nodes. Selecting this option can significantly impact the time it takes to train a model, and is recommended only for small data sets.
Interpreting Results
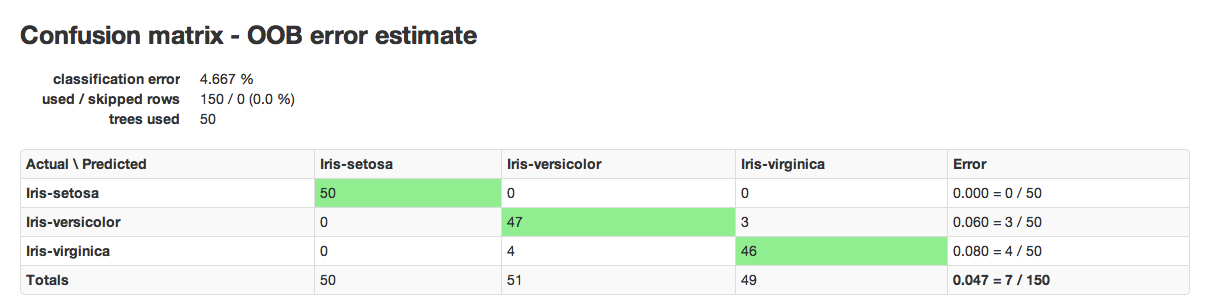
RF results are comprised of a model key and a confusion matrix. The model key specifies the full forest of trees to be used for predicting classifications.
An example of a confusion matrix is given below:
The highlighted fields across the diagonal indicate the number the number of true members of the class who were correctly predicted as true. In this case, of 111 total members of class F, 44 were correctly identified as class F, while a total of 80 observations were incorrectly classified as M or I, yielding an error rate of 0.654.
In the column for class F, 11 members of I were incorrectly classified as F, 56 as M, and a total of 111 observations in the set were identified as F.
The overall error rate is shown in the bottom right field. It reflects the total number of incorrect predictions divided by the total number of rows.
RF Error Rates
H2O’s Random Forest algorithm produces a dynamic confusion matrix. As each tree is built and OOBE (out of bag error estimate) is recalculated, the expected behavior is that the error rate increases before it decreases. This is a natural outcome of Random Forest’s learning process. When there are only a few trees built on random subsets, the error rate is expected to be relatively high. As more trees are added, resulting in more trees “voting” for the correct classification of the OOB data, the error rate should decrease.