Tableau 8.2
Have H2O Installed
Pre-requisites :
- 64-bit Oracle Java 1.6+
- Tableau 8.2 installed
- H2O installed in R (follow the download guide Install H2O package in R)
Metadata
Tableau requires some sort of data input to run, but when dealing with immensely big data as a H2O user would typically do, it is impractical and unnecessarily time-consuming to feed all the data into Tableau. So the solution is to create a small metadata file that can be easily loaded from the disk.
Note: In particular, geographic attributes like cities and latitude/longitude coordinates need to be imported into Tableau. Aggregates and calculated fields cannot be converted, so even if you have a vector of cities (New York City, San Francisco, Houston, Austin, Seattle) as a output from R into Tableau as a new measure, you cannot convert the measure into geographical points.
The metadata is a file with factor levels of the data frame that give a quick overview of the unique input values and cardinality of each column. This format will also allow the user to calculate across the table, making it easier to actually visualize some of the data coming from H2O. For example, if a column has a 352 categorical values and a binomial GLM is run with 352 coefficients in the output, Tableau allows plotting of the coefficients against the column.
The following data is a truncated metadata file for 116 million rows airline data set. This particular metadata file is only about 352 rows. A extra column was prepended to the data file to grab the column names of the actual data set. This column helps populate certain parameters in the workbook.
Colnames          Year        Month   DayofMonth      DayOfWeek       UniqueCarrier   Origin  OCity
Year              1988            1           1       1                   PI          SYR     Syracuse
Month             1989            2           2       2                   PS          LGA     New York
DayofMonth        1990            3           3       3                   TW          JFK     New York
DayOfWeek         1991            4           4       4                   UA          UCA     Utica
DepTime           1992            5           5       5                   WN          CHO     Charlottesville
CRSDepTime        1993            6           6       6                   EA          CLT     Charlotte
ArrTime           1994            7           7       7                   HP          EWR     Newark
CRSArrTime        1996            8           8                           NW          LYH     Lynchburg
UniqueCarrier     1998            9           9                           CO          ROA     Roanoke
FlightNum         2000            10          10                          DL          BWI     Baltimore
TailNum           2001            11          11                          AA          MYR     Myrtle Beach
ActualElapsedTime 2003            12          12                          US          GSO     Greensboro
CRSElapsedTime    2004                        13                          AS          ISP     Islip
AirTime           2005                        14                          AQ          CHS     Charleston
ArrDelay          2006                        15                          MQ          ORF     Norfolk
DepDelay          2007                        16                          OO          BGM     Binghamton
Origin            2008                        17                          XE          LAX     Los Angeles
Dest                                          18                          EV          SEA     Seattle
Distance                                      19                          DH          SJC     San Jose
Create R, Tableau, and Data Connections
Step 1
Install Rserve (the package built to create Rserve), load the Rserve library, and run Rserve or run Rserve with your desired port.
> install.packages("Rserve")
> library(Rserve)
> run.Rserve(port=6311)
Step 2
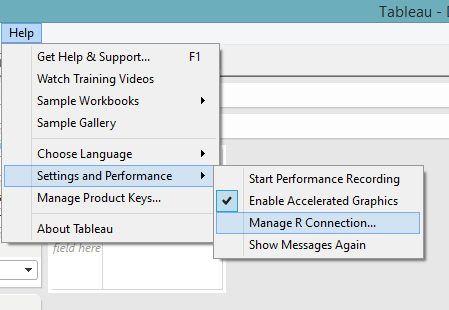
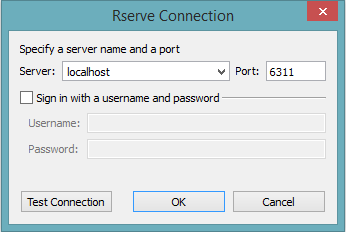
Open Demo_Template_8.2.twb, which should have all the calculated fields containing R scripts already in the sidebar. Navigate to “Help > Settings and Performance > Manage R Connection” to establish a connection to the Rserve.
Step 3
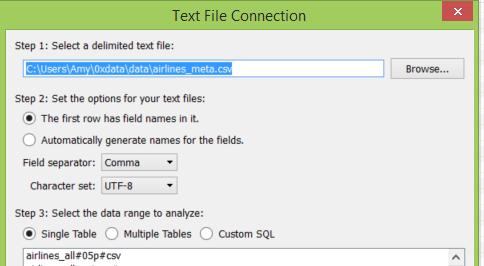
Set the workbook’s connection to the airlines_meta.csv data by navigating to the data section on the left sidebar, right-clicking on the airlines_meta, and choosing “Edit Connection.”
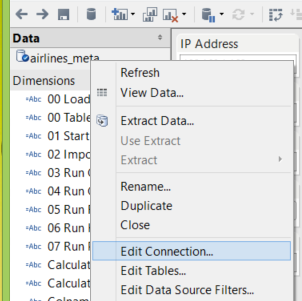
Provide the location of the airlines_meta.csv file and submit the new path. |
Step 4
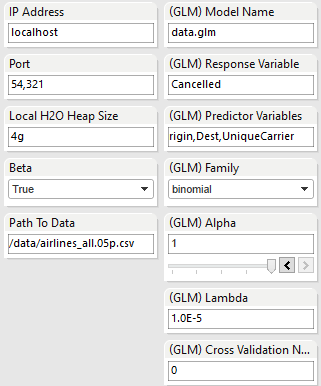
Configure the IP Address and Port that H2O uses to launch, as well as the path to the full airlines data file. Fill in the parameters to create a new GLM model. For documentation about the parameters, refer to our GLM documentation page Generalized Linear Model.
Execute Scripts
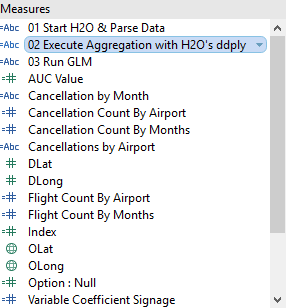
Move a calculated field under “Measures” to the worksheet to execute the R script in the field:
Step 1
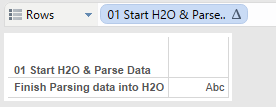
Move “01 Start H2O & Parse Data” to the Row shelf.
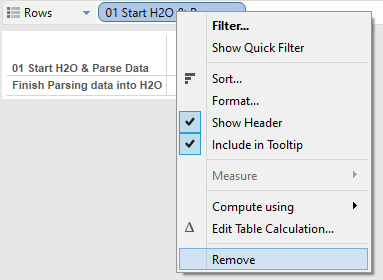
Step 2
Right-click the field on the Row shelf and select “Remove” to remove it from the worksheet.
Step 3
Repeat this calculated field “02 Execute Aggregation with H2O’s ddply” and “03 Run GLM” for all the calculations necessary for the dashboard.
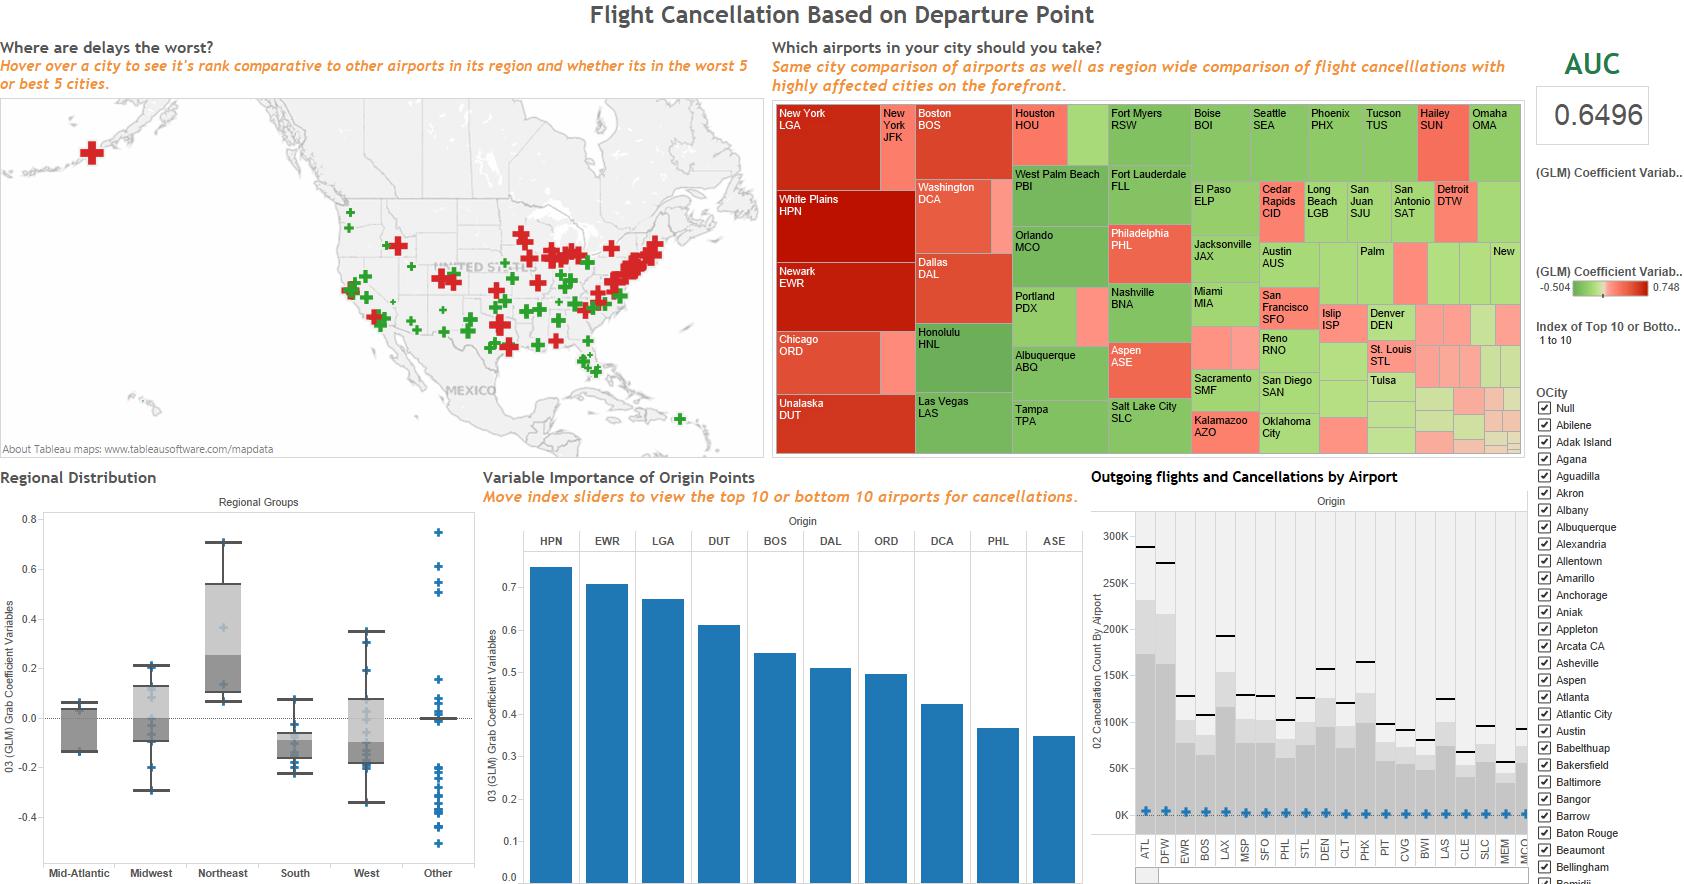
Navigate through the worksheets and dashboard